Partner Console Overview
The Partner Console is where an MSP partner manages all of its client organizations from one place: see users and AI use across clients, push and track policies, use templates, set up alert rules, and connect a ticketing system.
It's available to any organization that has at least one client. To add your first client, see Clients.
Open the Partner Console
- When you sign in to an organization that has clients, the console opens on the Partner Console Overview automatically.
- From inside an organization's console, open the organization switcher (top left) and select Switch to Partner View.
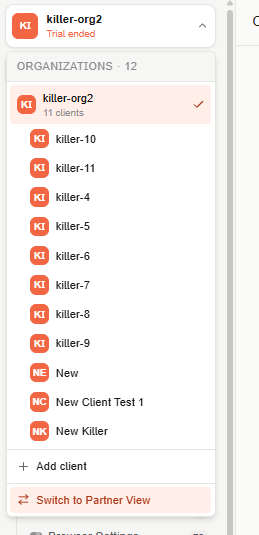
The switcher lists your partner organization with its number of clients, then each client. Select a client to work inside its own console; select Switch to Partner View to come back.
Navigation
The Partner Console has its own menu, grouped in four sections:
| Section | Pages |
|---|---|
| Partner | Overview, Clients |
| Monitor | Activity, AI across clients, Security Events, Unblock Requests |
| Controls | Policies, Templates, Alert Rules |
| Operate | Branding & Messages, Integrations, AI Assistant Access |
Overview
The Overview is a report of your portfolio: how many customers and users you manage, how many of them use AI, and how that changes from one period to the next — overall and per customer.
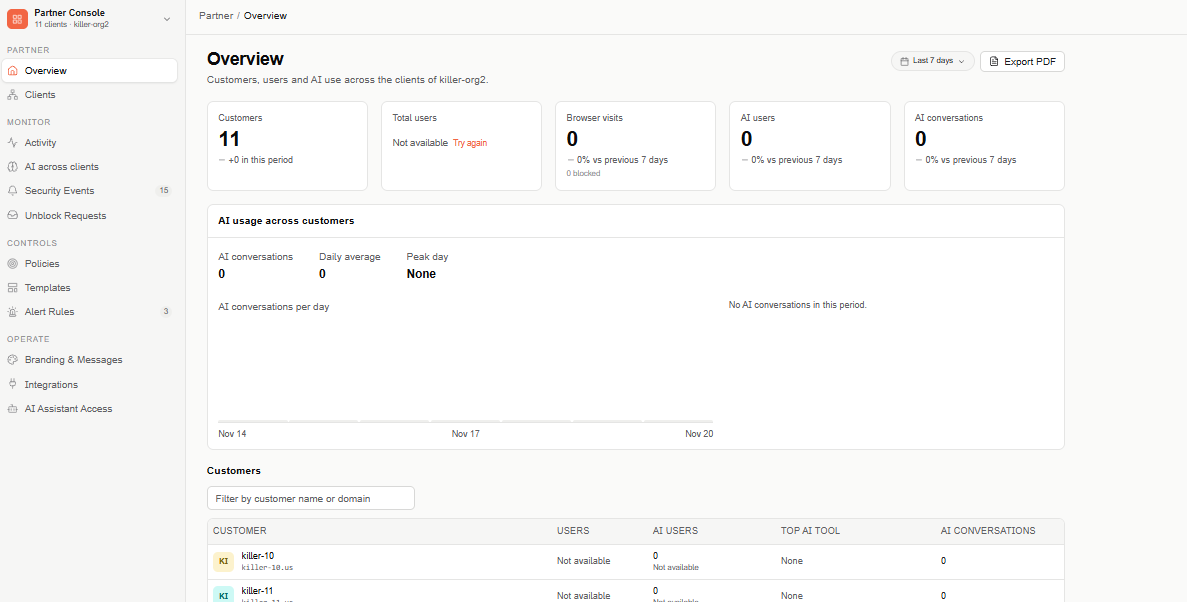
Use the period selector (top right) to choose Last 7 days, Last 30 days (default), or Last 90 days; every figure on the page uses it. Select Export PDF to print or save the page.
What's counted
The figures cover your direct clients only — not your partner organization's own data, and not clients below your direct clients. Clients that turned off partner access aren't counted, and a notice tells you how many were left out.
Overview metrics
- Customers — how many direct clients you have, and how many were added in the selected period.
- Total users — the sum of your clients' users.
- Browser visits — every browser visit across your clients in the period, with how many were blocked.
- AI users — people with at least one captured AI conversation in the period. A person who uses AI at two clients counts once.
- AI conversations — AI conversations captured across your clients in the period.
On 7 and 30 days, Browser visits, AI users, and AI conversations also show the change against the previous period of the same length. On 90 days there's no comparison.
If a figure can't be loaded, it shows Not available with Try again, without hiding the rest of the page.
AI usage across customers
This section shows the AI conversations in the period, the Daily average, and the Peak day, with a chart of AI conversations per day (hover a bar to see the day and its count) and the top AI tools ranked by conversations.
Customers
One row per client, sorted by users (highest first), 10 per page. Use Filter by customer name or domain to find one.
- Customer — the client's name and domain.
- Users — the client's users.
- AI users — how many of its users had an AI conversation in the period, and what share of its users that is.
- Top AI tool — the AI tool with the most conversations at that client in the period.
- AI conversations — the client's AI conversations in the period.
To open a client, use the organization switcher or the Clients page.
The AI figures, the AI usage section, and the AI columns are shown only to administrators who can view AI Conversations. Everyone with access to the Partner Console sees Customers, Total users, and the rest of the table.