Security Events
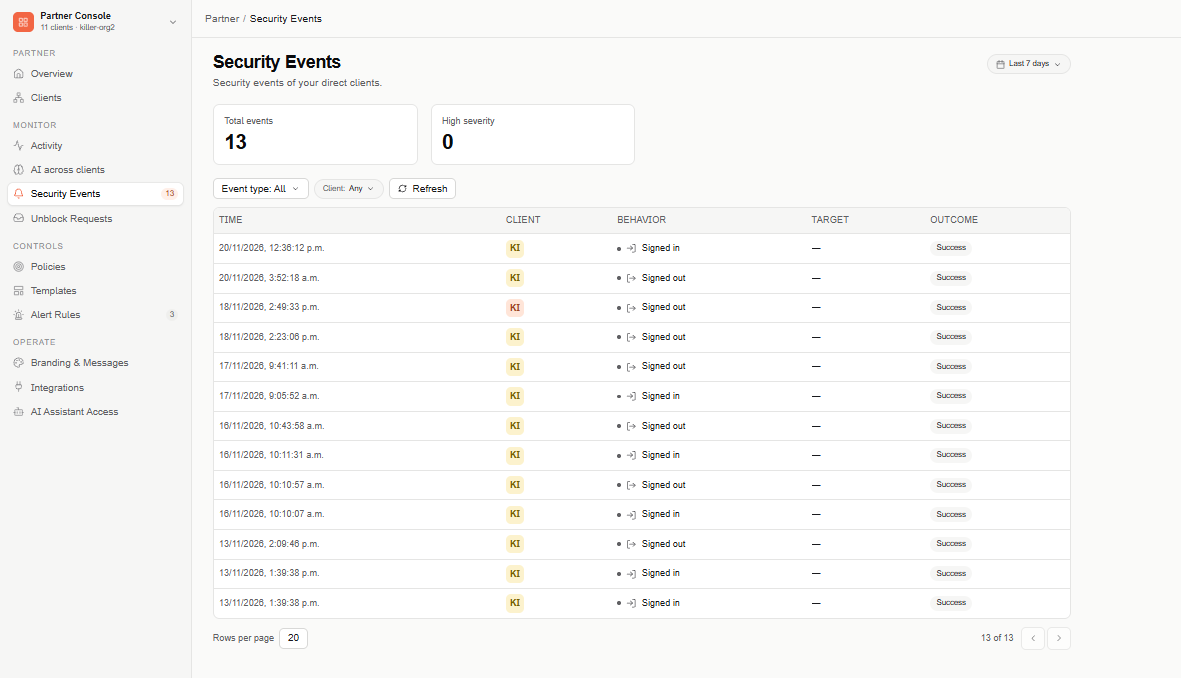
Security Events lists the security events of your direct clients in one place, labeled by client. It's the same data as each client's Security Events, across all of them.
Find this page at Partner Console > Monitor > Security Events. The badge next to it in the menu shows how many events your clients had in the last 7 days.
Overview metrics
- Total events — events in the selected range, with the filters applied.
- High severity — how many of those events are High or Critical severity.
If a metric can't be loaded, it shows Not available — never 0.
Filters
- Date range (top right) — Last 7 days by default.
- Event type — All, or one event type (for example, sign-ins or data masking).
- Client — Any client, or one direct client.
Select Refresh to reload the list.
Events table
The table is paginated (20 rows per page by default), newest first:
- Time — when the event occurred.
- Client — the client the event came from.
- Behavior — the detected action (for example, Signed in, Signed out, or Data masking).
- Target — the URL or host the behavior applied to, or a dash when there's none.
- Outcome — the result of the event (for example, Success).
Select a row to switch into that client and open its own Security Events page, where you can see who triggered the event and its full details. To come back, open the organization switcher and select Switch to Partner View.